Your cart is currently empty!
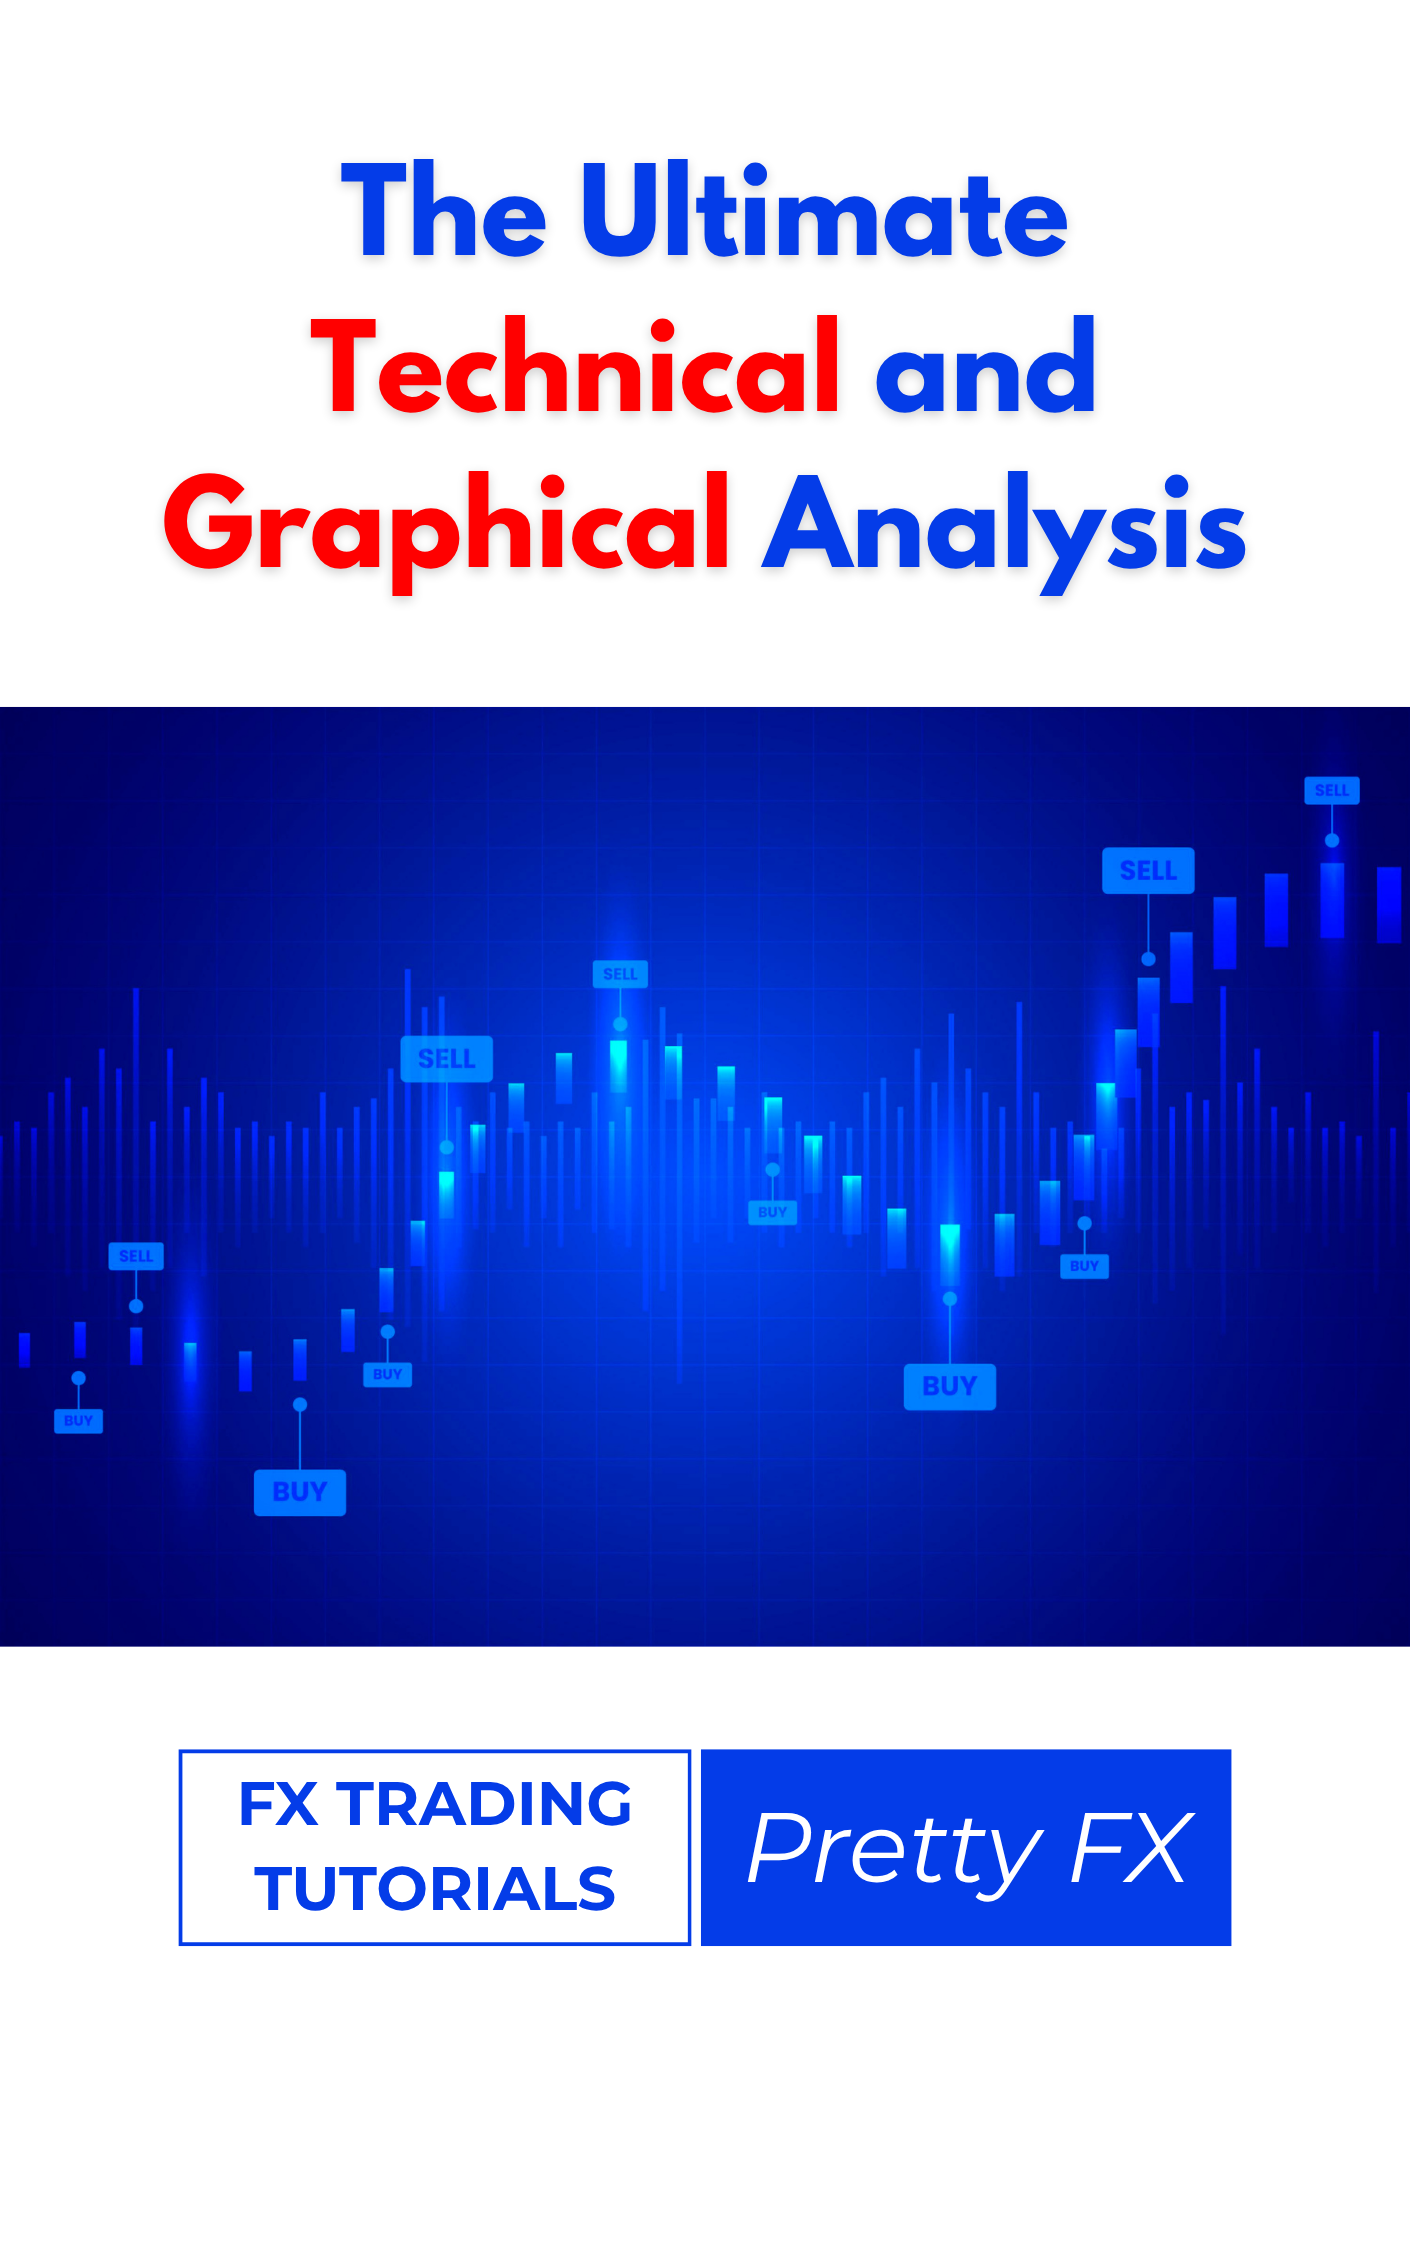
Trading Tutorials: The Ultimate Technical and Graphical Analysis
$ 9.99
Description
This tutorial takes the data-driven approach that many consider “scam-proof” because it relies on objective price charts to anticipate trends across stocks, crypto, and forex; it interprets candlestick patterns (bullish, bearish, and bilateral) for potential reversals or continuations, applies technical indicators such as SMA, MACD, RSI, VWAP, Bollinger Bands, Ichimoku Cloud, and Pivot Points to gauge trend, momentum, and key support/resistance, and reads chart patterns—including Flags, (Inverse) Head & Shoulders, Rounding Bottoms, Falling Wedges, Ascending/Descending/Symmetric Triangles, Cup-and-Handle, Double/Triple Tops and Bottoms, and Price Channels—to infer likely market behavior; by combining these tools, traders structure entry and exit decisions around probabilistic setups, forming a solid foundation for beginners and a refinement path for those seeking to enhance their technical analysis skills.
Related products
-
Advanced Carding For Pros
$ 9.99 -

Carding Mastery: List of Non VBV Bin – Non VBV Cards
$ 9.99 -
Carding Mastery! Advanced Carding By Ramirez
Original price was: $ 19.99.$ 9.99Current price is: $ 9.99. -

Carding Mastery! BINS That Bypass VBV, 3D Security
$ 9.99 -
Carding Mastery! Opening Bank A/C With Fullz
Original price was: $ 19.99.$ 9.99Current price is: $ 9.99.